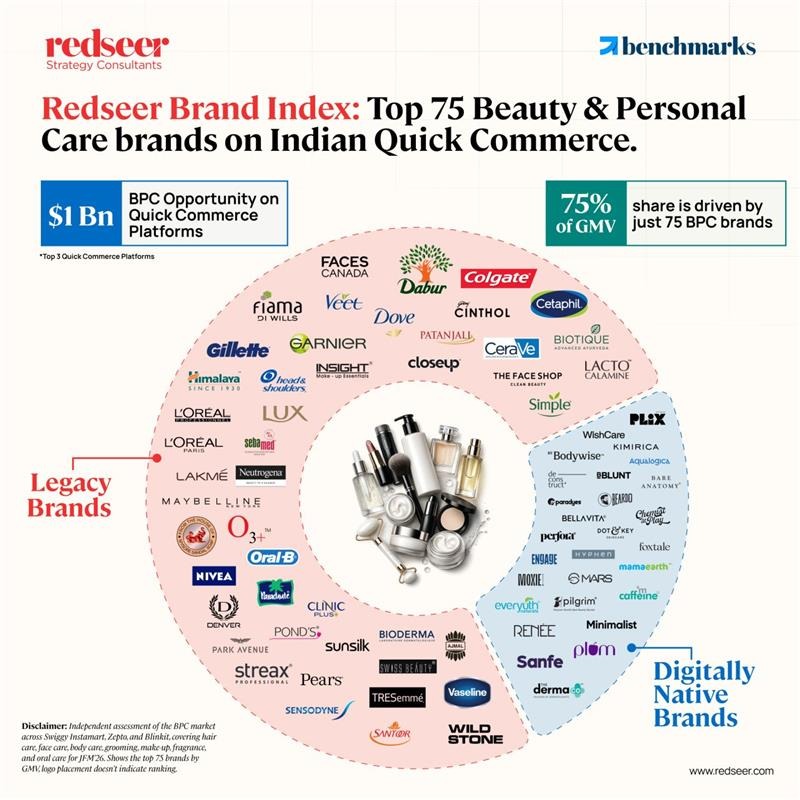
This index details out the Beauty & Personal Care performance on quick commerce – the categories, price points and pack sizes it rewards, who's winning the shelf, and how brands are building durable positions on it.
India's Beauty & Personal Care market is racing from $25 Bn to $40 Bn in five years. Quick commerce will carry 1 in 10 of those BPC dollars by FY31, fast becoming the channel that decides who wins wallet share.


What this report is about
A quarterly read on where quick commerce is taking Beauty & Personal Care — the categories, price points and pack sizes it rewards, who's winning the shelf, and how brands are building durable positions on it.
Why it matters now
If you are a legacy brand: the shelf that took your predecessors decades to win in general trade is being re-auctioned in quarters. Your brand trust transfers to a 10-minute basket — but only if your packs, prices and availability are QC-right before challengers set the category codes.
If you are a digitally-native brand: quick commerce converts demand fastest once brand trust is well established in the category — build that first, then let QC harvest it. Learn from the category performance and best-in-class examples to get your products, pack sizes and price points QC-right early.
The Opportunity and the Playbook to Win It
This index details out the Beauty & Personal Care performance on quick commerce – the categories, price points and pack sizes it rewards, who's winning the shelf, and how brands are building durable positions on it.
India's Beauty & Personal Care market is racing from $25 Bn to $40 Bn in five years. Quick commerce will carry 1 in 10 of those BPC dollars by FY31, fast becoming the channel that decides who wins wallet share.
Know how the opportunity is shaping up in quick commerce and what it means for BPC brands.
QC share of BPC to double in the next ~5 years: 1 in 10 BPC purchases in India to happen on quick-commerce by 2031
Impulse replenishment categories outperform on QC
QC wins where the trigger is 'I just ran out, order now' — oral care leads penetration, while bath & body, skin care and fragrance are above the 18% benchmark. Hair care and makeup trail, reflecting more considered purchases and wider assortments that are harder to curate onto QC's finite shelf
Shampoo, moisturizer and sunscreen lead the way on both volume and premiumization
Hero categories (high ASP × high GMV — sun care, face moisturiser, shampoo) reward full-price hero SKUs. Volume drivers (cleansers, oral, soap) win baskets at mass price points. Premium opportunity (perfumes, serums) proves shoppers pay ₹350–450 in ten minutes.
Small-mid sized packs win the 10-minute shelf
QC favors premium propositions: masstige + premium spends nearly double vs. the overall market
Masstige + premium spend is significantly higher on QC than the overall market (59% vs. 37%) — a pattern that holds across every category. QC's advantage for premium brands is solving a core distribution gap: access to premium labels in 10 minutes
A consolidated shelf, but open to new brands. Top 10 = 25%, next 65 = 50%
Rank is disproportionately valuable on the QC shelf — but there's real potential for smaller brands to climb, starting narrow: win a sub-category first, then use that position to move up the overall ranking
Legacy brands have an edge on QC, given their decades of trust; DNBs earn theirs first, then convert through QC
Legacy leans slightly harder on QC (63% vs 53% on e-commerce), likely reflecting QC's low-consideration basket. QC converts trust for every brand — legacy brings decades of it in at zero cost; DNBs have to build that trust elsewhere first (social media, D2C, traditional e-commerce), then bring it here to close
Winning brands ride on breakout SKUs: 7 of the top 10 have at least one

Two routes to the same shelf:
earn it new, or defend it well
Quick commerce rewards different approaches depending on where you start. Digitally-native brands must earn trust before QC will convert it. Legacy brands already have trust — their advantage is won or lost on execution and innovation speed.
The D2C-first route: know the customer well before you rent the shelf
Invested in a strong D2C channel — own website and mobile app first.
1P customer data validated PMF and cracked the hero product.
₹150 Cr body-lotion revenue in 2 years through a D2C-first approach (FY26).
Scaling fast on QC — #5 in body lotions, a space dominated by legacy giants.
The social + marketplace route: make the product famous, then make it instant
GenZ-first Influencer Marketing — making sunscreen a daily skin care habit.
Quirky, distinctive packaging became the trial hook.
₹800 Cr+ GMV in ~7 years, largely on marketplaces.
Scaling fast on QC — #3 in overall skincare.
Neither brand used QC to find customers — both used it to serve customers they had already won. On a low-consideration, rank-driven shelf, demand built off-platform is the moat.
Redseer Strategy Consultants
Guiding critical decisions in disruptive markets
Leading consumer growth advisors. For 17+ years, Redseer has been the growth advisor behind India's consumer internet and consumer brands story — finding the whitespace, decoding what it takes to win it, and turning that into decisions leadership teams can act on. This report is one example: a live, quarterly read on a shift most of the market hasn't fully priced in yet.
What we do
Three practices, one promise: decisions grounded in primary, granular market reality — not survey averages.
Strategic advisory to CXOs on growth
Decade-plus experience helping consumer brand leaders make the right strategic calls, and execute them: which channels to prioritize, how to adapt the product portfolio, margin structure & promotional choices to win on them, and where to expand next. Leader in consumer-focused strategy · #1 in digital-ecosystem advisory.
Transaction advisory
M&A, fundraising and exit advisory for consumer brands, alongside buy-side diligence for their investors (PE/VC). Leader in private-transactions advisory · #1 on IPO strategy in the region · deep track record in consumer, beauty, personal care and D2C transactions over the last decade.
Market insights — Benchmarks (benchmarks.digital)
Pioneers in tracking market and player performance & opportunity analysis (GMV, users, orders, operational metrics and unit economics) in India's internet sectors each month. Best-in-class IP and research on 150+ marketplaces / platforms and 5,000+ brands with a tech-led + human-led research approach — the platform this Index is built on.
How we partner with consumer brands
We drive growth across five core dimensions — from sizing the opportunity to closing inorganic deals.
- Opportunity sizing & landscape — TAM/SAM by segment, price point and sub-category; demand forecasting; competitive intensity; customer viewpoint.
- Growth roadmap design — company strengths, competitive edge, customer NPS and whitespace mapping, translated into a 3-year actionable plan.
- Channel-mix strategy — e-commerce, q-commerce, FSA, eB2B, D2C and social — sequencing, investment levels and a platform-by-platform playbook.
- Terms-of-trade optimization — data-driven negotiation playbooks with key channel partners, anchored in competitive benchmarks and unit economics.
- Geographic expansion — international entry and domestic city / micro-market deepening, sequenced by demand pockets and unit economics.
- New & adjacent category entry — attractiveness assessment, build-vs-buy decisioning and go-to-market design.
- Customer archetyping & targeting — persona identification, prioritization and proposition refinement for highest-value segments.
- Retention & wallet-share lift — NPS diagnostics, churn-driver analysis, loyalty design and cross-sell levers.
- Target identification & shortlisting — strategic-fit screen, synergy mapping and proprietary deal sourcing across the consumer ecosystem.
- Commercial & strategic due diligence — market-thesis validation, customer & competitive deep-dives and a value-creation roadmap for buy-side / sell-side.
Coverage — what the Index measures
The Index measures Beauty & Personal Care as consumers shop it — grooming, makeup, fragrance and oral care are in; adjacent hygiene, appliances and wellness categories are out, so brand shares are compared on a like-for-like shelf.
Inclusions and exclusions
| # | Category | Definitions | Included / excluded |
|---|---|---|---|
| 1 | Hair Care | Shampoo, conditioners, hair oil, serums, hair masks, sprays, hair colours, etc. | ✓ |
| 2 | Skin Care | Face wash, face scrub, cleansers, serums, moisturizers, toner, sheet masks, lip balms, sunscreens, eye cream, etc. | ✓ |
| 3 | Bath & Body | Body lotions, soaps, shower gels, body scrub, foot creams, hand care, shaving cream, aftershave, beard care, cartridges & razors, roll-ons, deodorants, manicure & pedicure kits, loofahs & scrubbers etc. etc. | ✓ |
| 4 | Makeup and Colour Cosmetics | Face, eye, body, lip and nail makeup; makeup remover | ✓ |
| 5 | Fragrance | Perfumes, attar, colognes | ✓ |
| 6 | Oral Care | Toothbrushes, floss, toothpaste, rinsers, sprays, tongue cleaners, etc. | ✓ |
| 7 | Sanitary care | Sanitizing wipes, hand sanitizer, sanitization kits, surface spray | — |
| 8 | Beauty appliances | Straighteners, trimmers, curlers, steamers, facial steamers, etc. | — |
| 9 | Hygiene and wellness | Sanitary pads, feminine wipes, sexual wellness, etc. | — |
| 10 | Nutraceuticals (vitamins, etc.) | Vitamin tablets, supplements, herbal products, etc. | — |
Definitions — the terms behind the numbers
Nine definitions govern every chart in this Index. When in doubt, this page wins.
Mass — Affordable body lotions priced below ₹1.5 per ml, targeting a broad consumer base.
Masstige — Mid-range body lotions priced between ₹1.5 and ₹6 per ml, offering a balance of affordability and premium appeal.
Premium — High-end body lotions priced above ₹6 per ml, featuring premium ingredients, elevated formulations, and prestige branding.
Disclaimer & terms of use
This Index is an independent Redseer assessment, provided for general information only. Please read the terms below before using or citing any figure from it.
1. Scope of this assessment
This Index has been prepared by Redseer Strategy Consultants (“Redseer”) as an independent assessment of the Beauty & Personal Care market across Swiggy Instamart, Zepto and Blinkit.
2. Research limitations
The information provided in the Index is subject to limitations, including, among others, the nature of the underlying data and statistical analysis, the structured and unstructured research datasets used, and publicly available information. Accordingly, the findings do not purport to be exhaustive.
While we have taken due care and caution in preparing the deliverables based on the research available to us, we do not guarantee or warrant the accuracy, completeness, merchantability or reliability of the information. The underlying assumptions are further subject to limitations such as the interpretation of market scenarios across sources, data availability, and similar factors. You acknowledge that no information provided by Redseer is audited or independently verified.
3. Third-party trademarks
All third-party names, logos, product and service names, designs and slogans (collectively, “Third-Party Trademarks”) contained in this document are the property of their respective owners. Third-Party Trademarks are used only to refer to the owners of the Third-Party Trademarks in question, and such use does not constitute or imply any relationship between Redseer and those owners, including any affiliation, sponsorship, endorsement or approval of products and/or services, unless otherwise expressly indicated.
4. No recommendations
The Index is provided on an “as-is” basis for general information only and is not intended to provide advice or make recommendations regarding any specific subject matter. Any commercial, business or other decisions based on this Index or on the information provided by Redseer are the sole responsibility and liability of the entity or person making such decisions, and Redseer shall not be liable in any manner whatsoever. Redseer, its affiliates and associated parties shall not be liable for any actions — including any business or commercial decisions — taken by the recipient on the basis of this document.
5. Limitation of liability
In no event shall Redseer or its partners, directors, employees, consultants or agents be liable to any third party for any decision made, action taken or omission made in reliance on the information provided in this document, or for any errors, inaccuracies or omissions in it, or for merchantability or fitness for purpose. This includes any losses, injuries or damages — whether incidental, consequential, special, punitive, economic or similar, including loss of goodwill, loss of business or loss of profits arising out of or in connection with the use of any information in this document.
6. Right to modify
Redseer reserves the right to modify any data or deliverable in subsequent periods without attributing a reason, and is not obligated to correct previously provided information as new information becomes available.
Copyright © Redseer Strategy Consultants Private Limited (“Redseer”). All rights reserved.
Thought Leadership Reports
Selected Redseer research on India BPC, quick commerce and consumer brands.
Request Access to Brand Index
Tell us about your business. We'll walk you through the index in a virtual discussion and unlock the access as needed.