BPC Brands on Quick Commerce India 2026: The $1 Billion Shelf That’s Rewriting Beauty Retail
India’s beauty and personal care market is large, fast-growing, and being fundamentally reshuffled by quick commerce. The shelf that took legacy brands decades to build in general trade is being re-auctioned, category by category, in quarterly cycles. BPC brands on quick commerce India face a structural inflection point: the channel is already at scale, premiumising fast, and rewarding very specific execution patterns.
Redseer’s Brand Index, a quarterly read on quick commerce BPC performance across 1,500+ brands, tracks exactly what is happening on this shelf. The JFM 2026 edition covers the January-March 2026 quarter and provides the most granular publicly available view of how categories, pack sizes, price tiers, and brand types are performing on India’s leading quick commerce platforms.
Request Access to the Redseer Brand Index
A Billion-Dollar Shelf, Growing at 90%
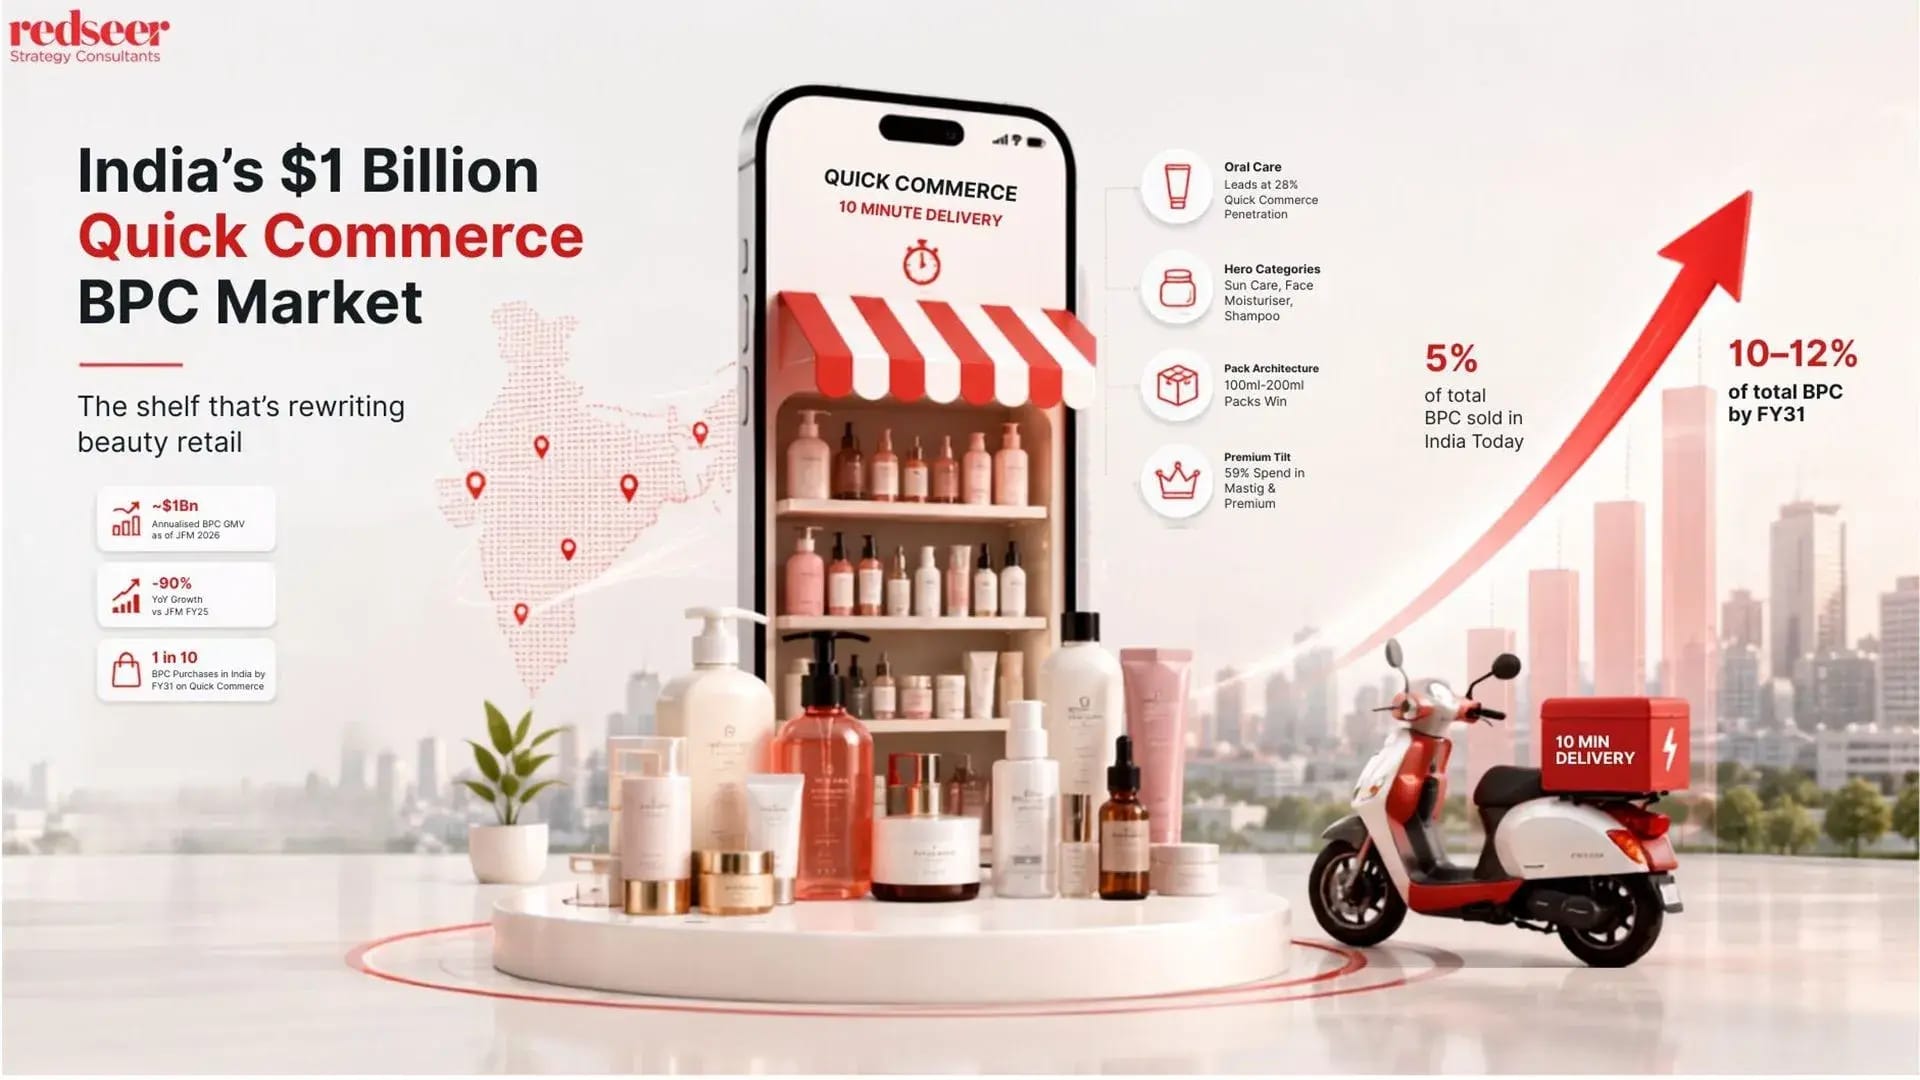
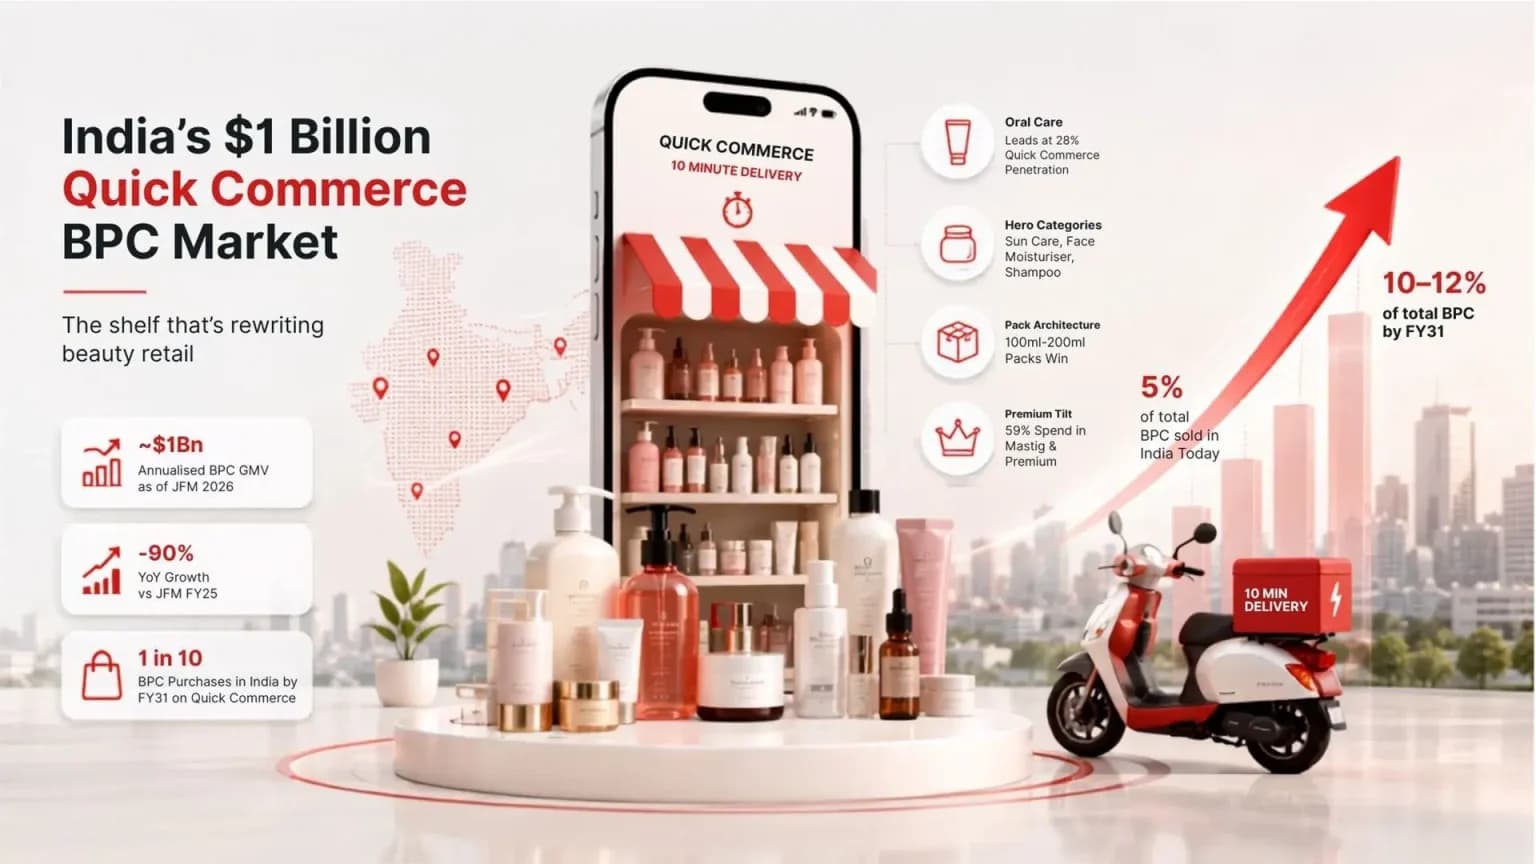
The scale of quick commerce in BPC is no longer a question. The top-three quick commerce platforms have collectively reached approximately $1 Bn in annualised BPC GMV as of JFM 2026, growing at roughly 90% year-on-year compared to the same quarter in FY25.
To put that in context: India’s total BPC market stands at $25 Bn today and is forecast to reach $41-48 Bn by FY31, compounding at 11-14%. Online penetration is rising from 25% of total BPC today to 37-40% by FY31. Within online, quick commerce is expanding its share from 18% to an estimated 27-31%. Translated to total market terms, quick commerce is moving from 5% of all BPC sold in India today to 10-12% by FY31, meaning 1 in every 10 BPC purchases in India will happen on a quick commerce platform within five years.
The implication for brand strategy is direct. Quick commerce is no longer a supplementary channel to activate once core distribution is in place. For many categories, it is becoming the marginal unit of demand, the place where impulse, replenishment, and premiumisation intersect.
Request Access to the Redseer Brand Index
Which Categories Win on Quick Commerce?
Not all BPC categories benefit equally from quick commerce’s core mechanic: the impulse-to-delivery loop. Against an overall online BPC benchmark of 18% quick commerce penetration, categories split sharply based on one factor – whether the primary purchase trigger is ‘I just ran out’ or ‘I want to explore.’
Oral care leads at 28% quick commerce penetration of online BPC GMV. Toothpaste, mouthwash, floss and these are non-discretionary replenishment categories. When stock runs out, the need is immediate. Quick commerce is a natural fit.
At the other end, makeup and colour cosmetics sits at 12%, well below the benchmark. Discovery-led categories, where consumers browse, compare shades, and read reviews before buying, still live primarily on horizontal and vertical e-commerce platforms where the browse experience is richer.
Between these poles, skin care and hair care sit in a middle zone where brand recognition unlocks quick commerce volume. Once a consumer has made a considered purchase through another channel and established a preferred product, quick commerce handles the reorder.
Hero categories, those combining both high GMV scale and high average selling price, are sun care, face moisturiser, and shampoo. These categories reward a specific playbook: a full-price hero SKU with strong brand equity, positioned at a premium or masstige price point, with appropriate pack sizing for the 10-minute delivery context.
Pack Size, Pricing, and the Premium Tilt
Two structural characteristics separate the quick commerce BPC shelf from general trade and traditional e-commerce: pack mix and price tier.
Pack architecture matters
The same product that sells in 500ml or 1-litre packs on general trade tends to perform in 100ml-200ml packs on quick commerce. The Index illustrates this with examples from leading sunscreen and body lotion categories, where the pack mix shifts materially between overall e-commerce and quick commerce. The 10-minute delivery context creates a different basket logic – consumers buying for immediate use or top-up rather than monthly stock-up. Brands that have not adapted their pack architecture for the quick commerce channel are leaving conversion on the table.
Price tier tilts premium
Quick commerce’s consumer base skews toward urban, higher-income households who place a value on time. The result shows up directly in the spending data: masstige and premium categories account for 59% of quick commerce BPC spend, compared to 37% across the overall market (online and offline combined). Mass products are not absent from the quick commerce shelf, but the channel systematically over-indexes for premium propositions.
For brands, this creates a specific opportunity. Quick commerce is not just a convenience channel – it is a premiumisation channel. Brands with masstige or premium positioning can use quick commerce both to serve existing high-intent consumers and to pull category-adjacent consumers upmarket.
The Brand Battlefield: Who Holds the QC Shelf?
Redseer’s Brand Index ranks 1,500+ BPC brands by JFM 2026 GMV across the top-three quick commerce platforms. The distribution of that GMV tells a precise story about shelf dynamics.
- Top 10 brands account for 25% of total quick commerce BPC GMV
- Next 65 brands account for 50% of total GMV
- 1,500+ remaining brands share the final 25%, a long tail that is active and breakable
This structure is concentrated at the top but not closed. The data shows real potential for smaller brands to break into higher rank buckets with the right SKU, pack, and pricing decisions.
DNBs (digitally-native brands) hold 17% of overall BPC GMV (online and offline). On quick commerce, that rises to 37%. On traditional e-commerce, DNBs reach 47%.
The pattern reflects a structural difference in how brand trust works across channels. Legacy brands built consumer trust over decades through general trade and traditional advertising. That trust converts powerfully on quick commerce, where low consideration time favours known brands, and legacy brands lean into this: 63% of their online GMV runs through quick commerce versus 53% for DNBs.
SKU concentration is the signature of a top-ranked brand. Seven of the top 10 brands on the quick commerce BPC leaderboard have at least one SKU crossing an annualised GMV of Rs 20 Cr. A breakout hero SKU is not a coincidence at the top of the rankings, it is a pattern.
Request Access to the Redseer Brand Index
Two Playbooks for Winning: DNBs vs Legacy Brands
The Brand Index includes four case studies, two for digitally-native brands and two for legacy brands, that trace specific winning paths to quick commerce scale.
DNB Playbook: Win the customer before you rent the shelf
Both DNB case studies share the same central insight: quick commerce was not the customer acquisition channel. It was the fulfilment channel for customers already won elsewhere.
One leading DNB in body lotions built a strong D2C channel first, its own website and app. First-party customer data validated the hero product and de-risked the SKU before any shelf rental was paid on a quick commerce platform. The brand scaled to Rs 150 Cr in body-lotion GMV within two years and reached the top five in its category on quick commerce.
A second DNB, in sunscreen and broader skin care, used Gen Z-focused influencer marketing to make sunscreen a daily habit. After reaching Rs 800 Cr+ in GMV across approximately seven years (primarily through marketplaces), the brand is now scaling fast on quick commerce, ranking in the top three in overall skincare. Social media created the want; quick commerce closes it – for first purchase and every reorder after.
Legacy Playbook: Defend the core, then own the next category
For legacy brands, the playbook centres on category innovation rather than customer acquisition, because the brand trust that drives quick commerce conversion is already in place.
One bath, body and hair care brand identified hair masks as a high-potential adjacency to its core range. Its existing presence on quick commerce provided a live testing environment at real volume. The brand is now ranked second in hair masks on quick commerce with roughly 20% category share.
A second legacy player, in makeup and colour cosmetics, observed a DNB-proven sunscreen habituation trend and reformulated, removing oiliness, white cast, and stickiness that category incumbents had not addressed. Sunscreen now accounts for 15-20% of this brand’s total quick commerce GMV. You do not have to originate the trend to own it.
What This Means for BPC Strategy
A few readings from the data that hold across brand type.
The channel does not find customers, it serves them. Neither the DNB case studies nor the legacy ones used quick commerce as a discovery mechanism. Discovery happened on D2C, social, or marketplace channels. Quick commerce captured the repeat demand that those channels created.
Pack architecture is a strategic decision, not a logistics afterthought. Brands that have not built a pack architecture specific to the 10-minute delivery basket, smaller sizes, clear individual SKU identity, price points that work at masstige are carrying general trade logic into a channel with different consumer intent.
Premium is where the channel’s attention is concentrated. With masstige and premium accounting for 59% of quick commerce BPC spend versus 37% overall, the channel disproportionately rewards upmarket positioning. For brands deciding which SKUs to activate on quick commerce first, the data consistently points toward the higher end of the range.
Hero SKUs are not accidents. Seven of the top 10 brands have a single SKU above Rs 20 Cr in annualised GMV. Breadth of assortment does not explain leadership on this channel – a concentrated bet on a category-defining product does.
The full Redseer Brand Index includes category-level penetration data, brand ranking tables, parent-company GMV views, and complete case study analyses. Request access here.
Frequently Asked Questions
What is the Redseer Brand Index?
The Redseer Brand Index is a quarterly publication tracking 1,500+ beauty and personal care brands across India’s leading quick commerce platforms. The JFM 2026 edition covers January-March 2026 GMV data across oral care, skin care, hair care, bath and body, makeup, fragrance, and related categories.
How big is the quick commerce BPC market in India?
The top-three quick commerce platforms have collectively reached approximately $1 Bn in annualised BPC GMV as of JFM 2026, growing at around 90% year-on-year. Quick commerce accounts for 5% of India’s total $25 Bn BPC market today and is projected to reach 10-12% by FY31.
Which BPC categories perform best on quick commerce?
Oral care leads quick commerce penetration of online BPC GMV at 28%, well above the 18% overall benchmark. Makeup trails at 12%. Hero categories combining high GMV and high average selling price include sun care, face moisturiser, and shampoo.
How do DNBs compare to legacy brands on quick commerce?
DNBs hold 37% of quick commerce BPC GMV despite only 17% of overall BPC. Legacy brands lean more on quick commerce (63% of their online GMV) versus 53% for DNBs, reflecting stronger brand trust in low-consideration purchase situations.
What price tier performs best on quick commerce BPC?
Masstige and premium products account for 59% of quick commerce BPC spend, compared to 37% across the overall market. Quick commerce over-indexes for premium propositions because its consumer base skews toward higher-income urban shoppers.
How should a brand approach quick commerce for the first time?
The Brand Index case studies consistently show that quick commerce performs best as a fulfilment channel for customers already acquired elsewhere, through D2C, social, or marketplace channels. The first priority is building brand trust. The second is identifying a hero SKU with the right pack size and price tier. The third is using the channel’s quarterly feedback data to iterate fast on assortment and pack architecture.
Key Takeaways
The story of BPC brands on quick commerce India is at an inflection point. A channel that barely registered in BPC three years ago now sits at $1 Bn in annualised GMV and is growing at 90% year-on-year. By FY31, 1 in 10 BPC purchases in India will happen on quick commerce.
The structural characteristics of this channel are becoming clear. It rewards premium and masstige positioning. It favours brands with pre-existing consumer trust. It converts on replenishment and urgency, not discovery. It amplifies hero SKUs and punishes unfocused assortments. And it provides a quarterly feedback loop that brands can use to test, learn, and expand faster than any other channel.
Redseer’s Brand Index, tracking 1,500+ brands, with case studies drawn from real brand trajectories, is the most comprehensive publicly available read on where this channel is heading and who is winning it.