
Speed in Metro, Scale in Bharat: India’s $80 Bn Online Retail Story
India’s online retail market has reached ~$80 Bn in FY26, growing at 21% year-on-year. The three structural shifts defining this growth are:
- Quick Commerce emerging as the dominant growth engine in metro India, reaching 17% of total online retail and growing at ~120% year-on-year in FY26
- Value Commerce is enabling first-time online shoppers across Tier 2+ India through affordability and organic trust, establishing itself as the primary driver of new user growth.
- New user acquisition shifting decisively toward Tier 2+ India, expanding the annual transacting user base to 320-340 million in FY26
The online market from one platform, all consumer cohorts have been shifting to narrower cohort-specific channels catering to distinct consumer needs. Quick Commerce serves urban India’s demand for speed and immediacy. Value Commerce serves Tier 2+ Bharat’s demand for access and affordability.
Note: All USD figures converted at 1 USD = ₹85
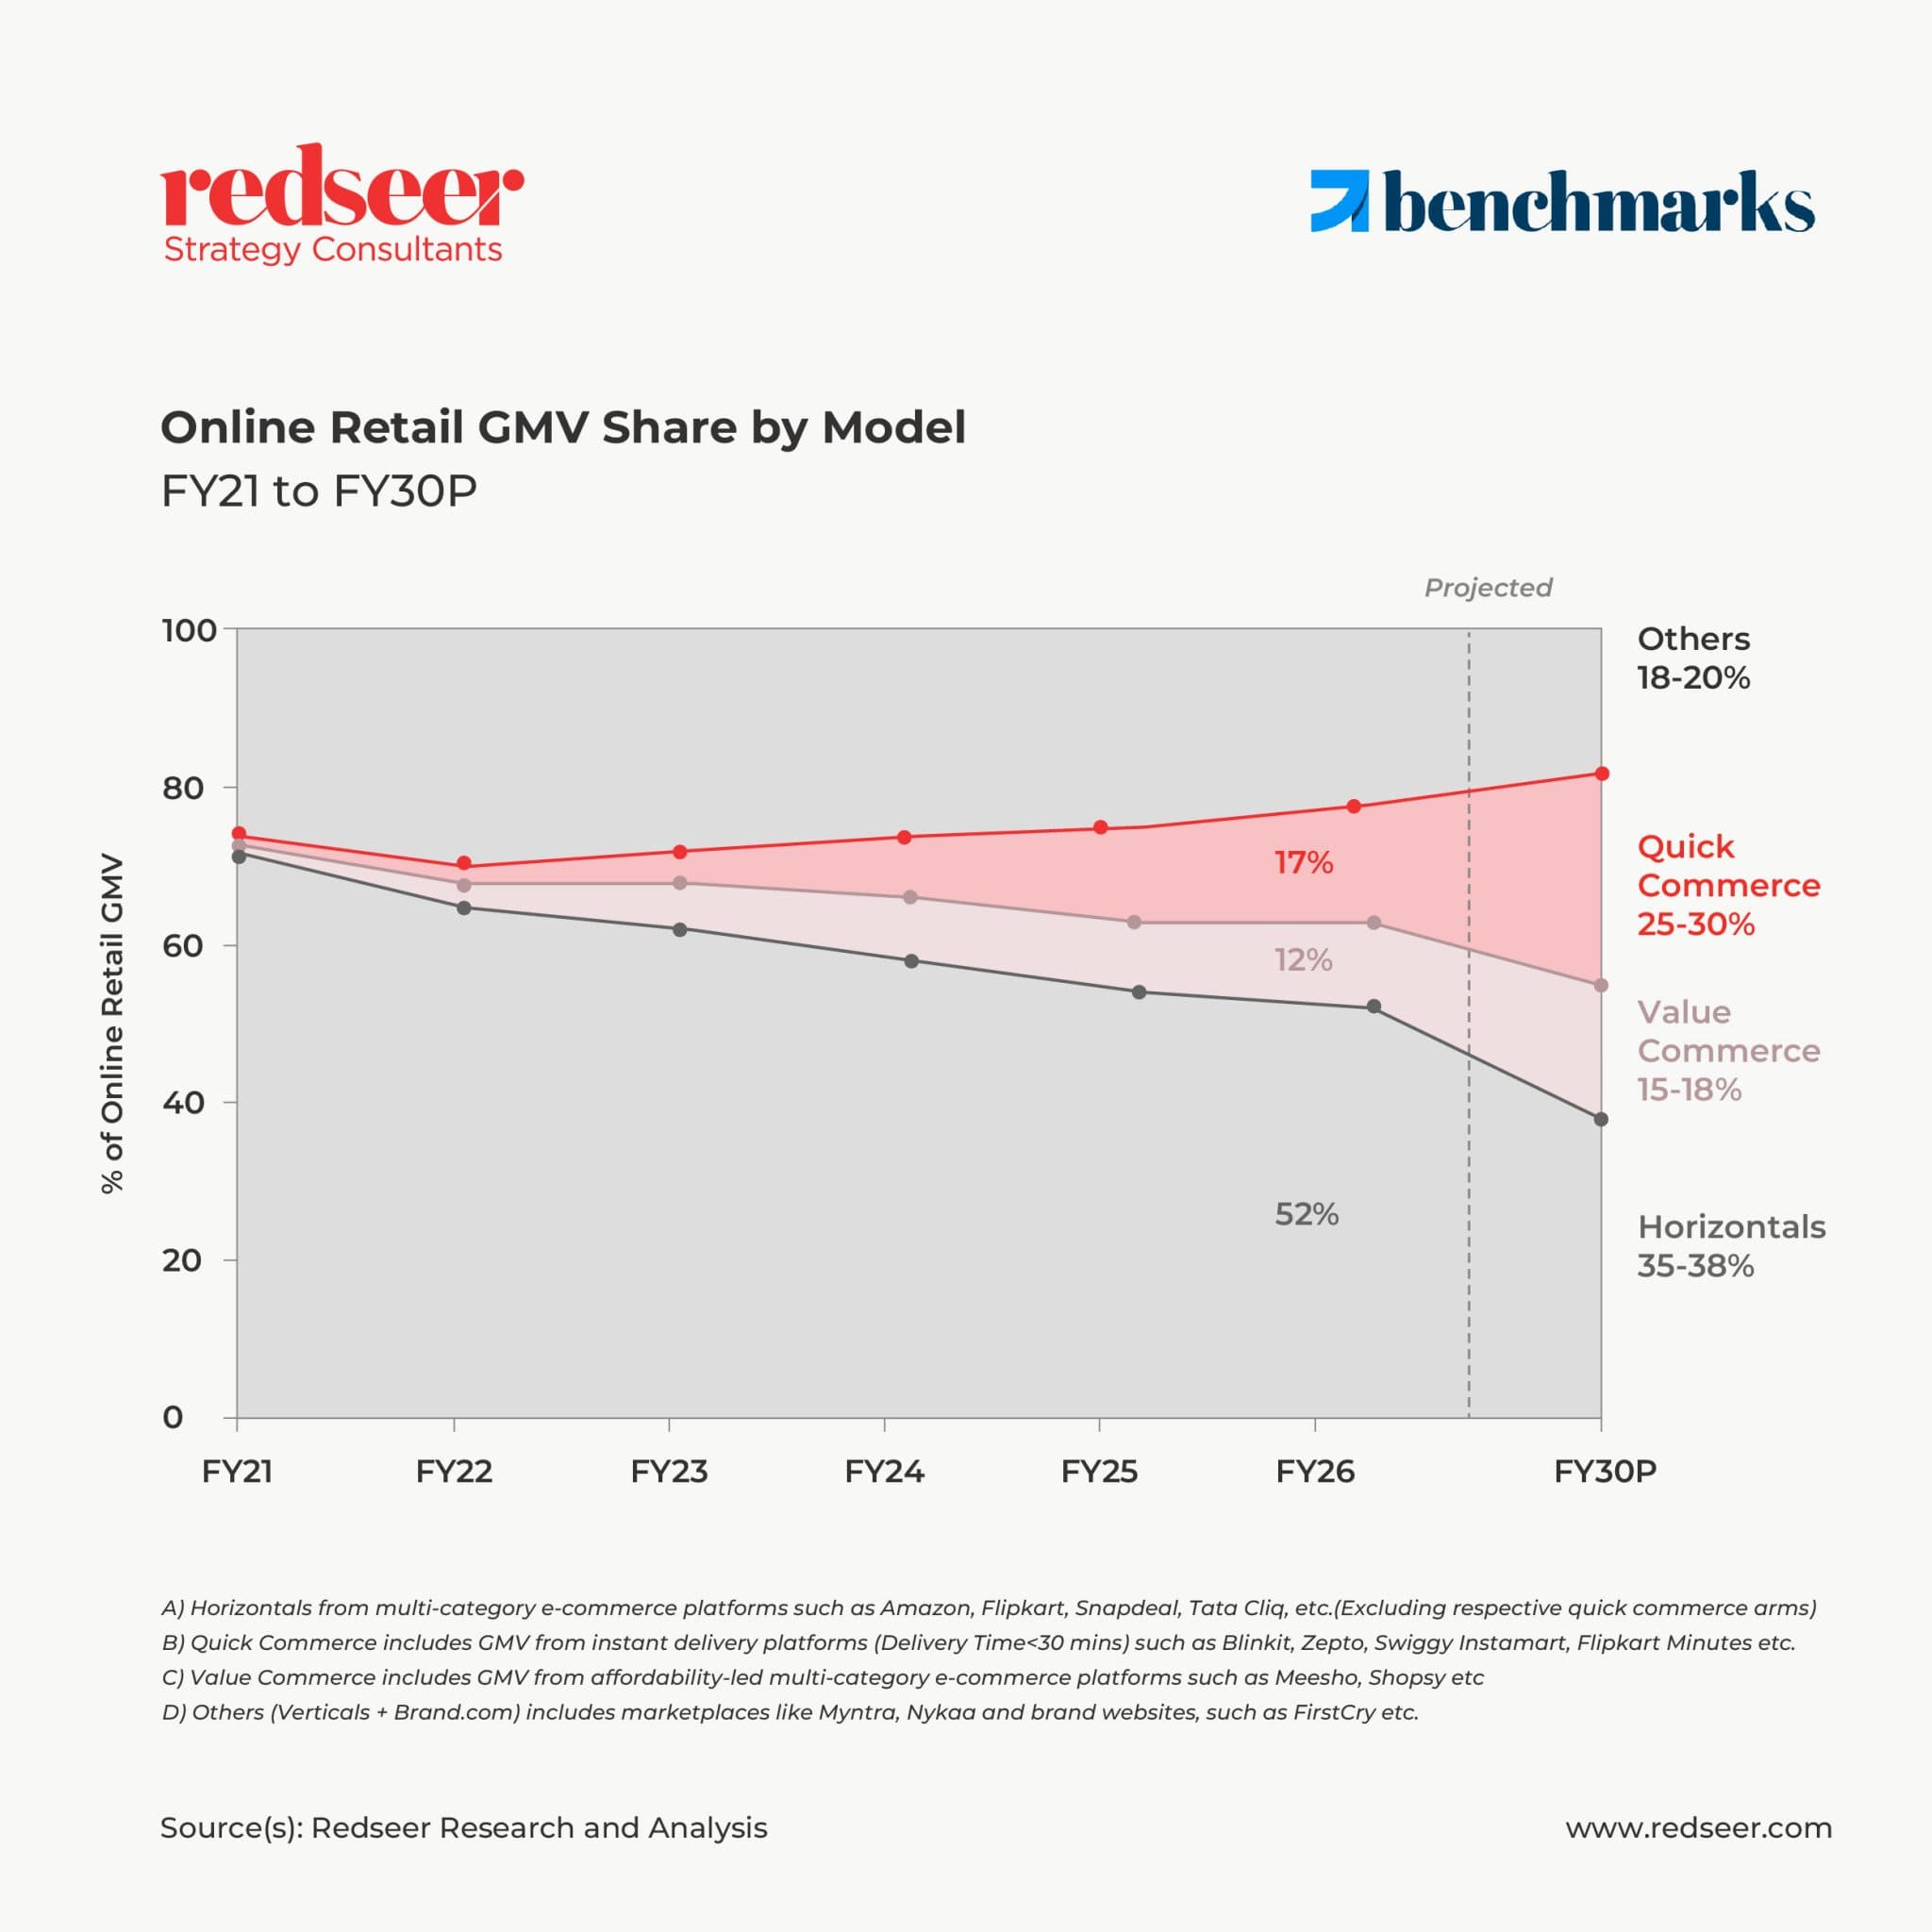
FY21 to FY30P – The Channel Evolution
Both channels have grown in different proportions, serving their cohort needs, but at what rate and what’s at the end of the tunnel?
Quick Commerce and Value Commerce have grown from a combined ~2% of online retail GMV in FY21 to ~30% in FY26, expanding the overall market. By FY30, these two models are projected to represent 40%+ of total online retail GMV, with Quick Commerce at 25 to 30% and Value Commerce at 15 to 18%. The market is not being redistributed. It is being expanded by models that reach consumers and occasions the traditional marketplace was not built to serve.
Quick Commerce
Quick Commerce closed FY26 at approximately $13 to $14 billion, representing ~17% of total online retail GMV. The more instructive number is not how far it has come but how much runway remains.
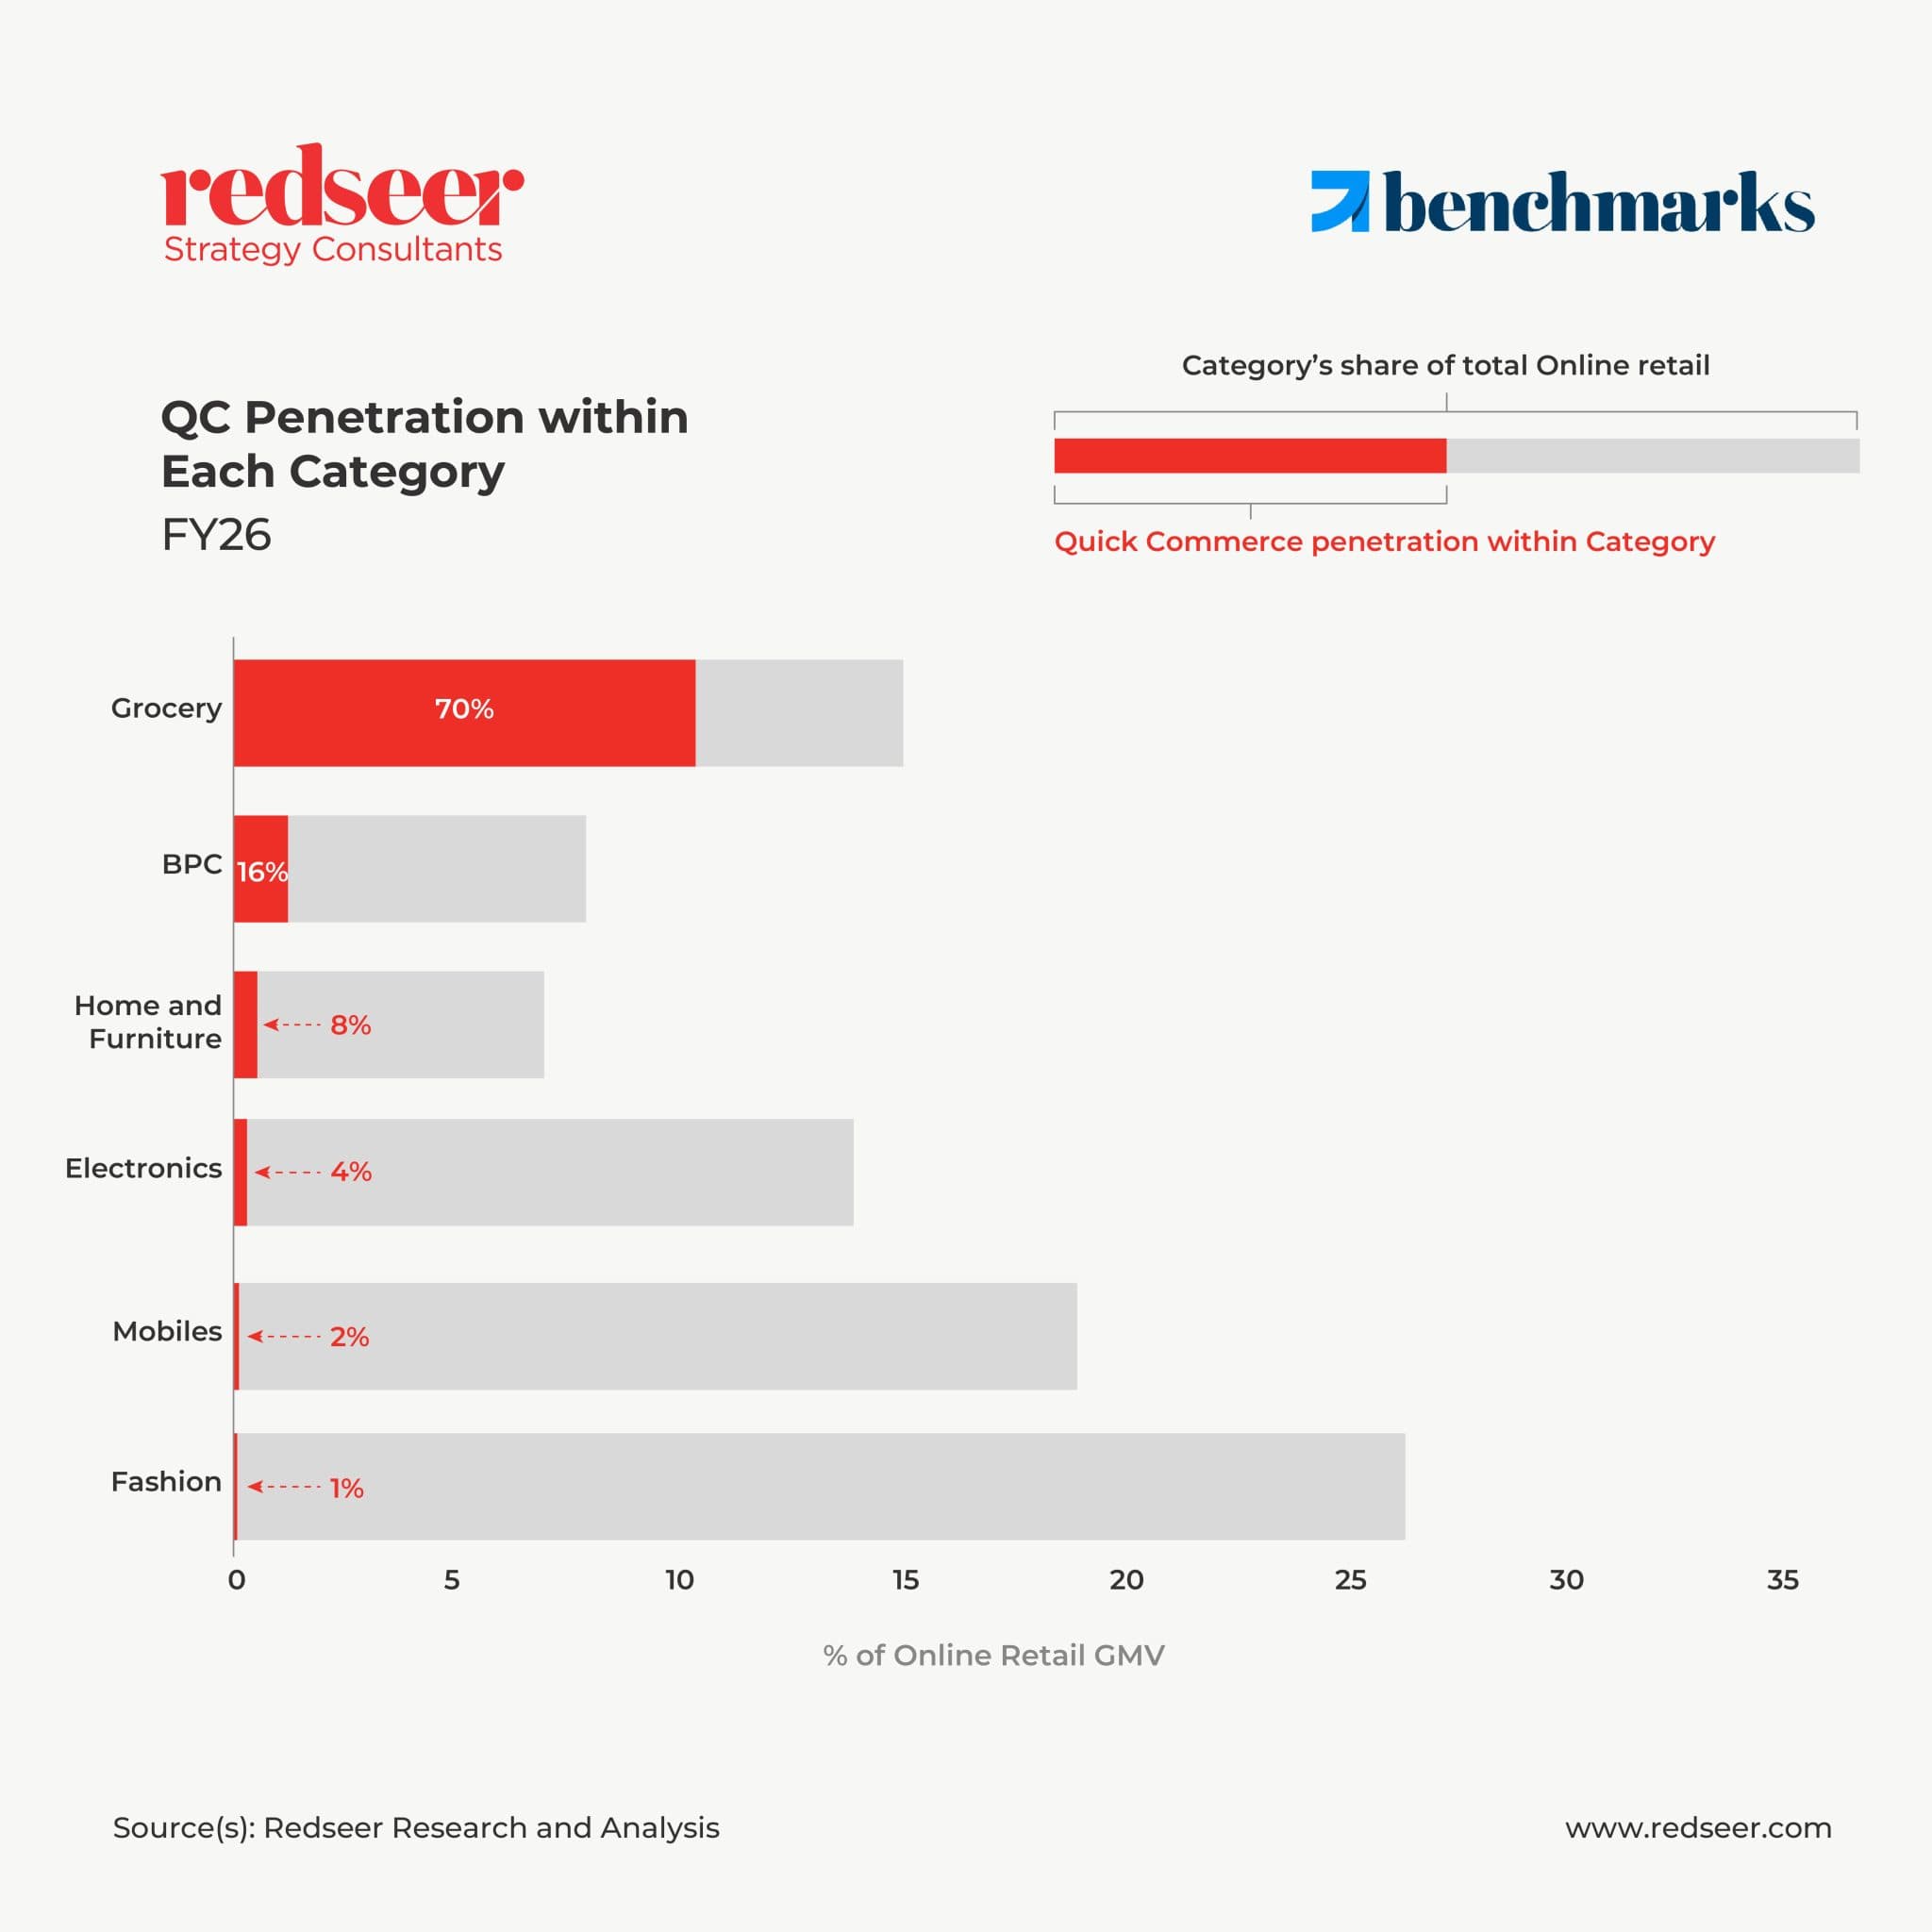
Quick Commerce commands ~70% of online grocery, yet online grocery itself represents only ~2% of total grocery retail, meaning Quick Commerce has barely begun serving its true addressable market. More significantly, Quick Commerce accounts for less than 5% within online Fashion, Mobiles and Electronics, categories collectively representing nearly 60% of India’s online retail GMV.
Geographically, the profitability frontier is more precisely defined than market commentary suggests. In mature metro markets, platforms with AOV (at selling price) of INR 500+ (~$5.9) and Order per dark store per day of 1,200 to 1,400 are demonstrating positive contribution margin. Profitability requires the right balance of AOV and order density working together. Improving either lever in isolation is not sufficient.
As Quick Commerce enters its next phase, three strategic vectors compete for priority. Geographic densification in Tier 1 and beyond markets, category diversification beyond grocery, and deepening wallet share within existing users. Each carries a different unit economics profile. Compounding this is the wallet question.
Multiple players now compete for the same urban consumer, distributing a finite wallet across more platforms and compressing per-platform order density. The category is growing. Platform economics catching up to that growth is the unresolved bet of FY27
Value Commerce
Value Commerce closed FY26 at 12% of total online retail GMV, up from 1% in FY21, growing ~40% year-on-year(FY26). Average selling price has been deliberately compressed, prioritising user depth and first-time shopper acquisition over per-transaction revenue. Volume first, revenue optimisation second.
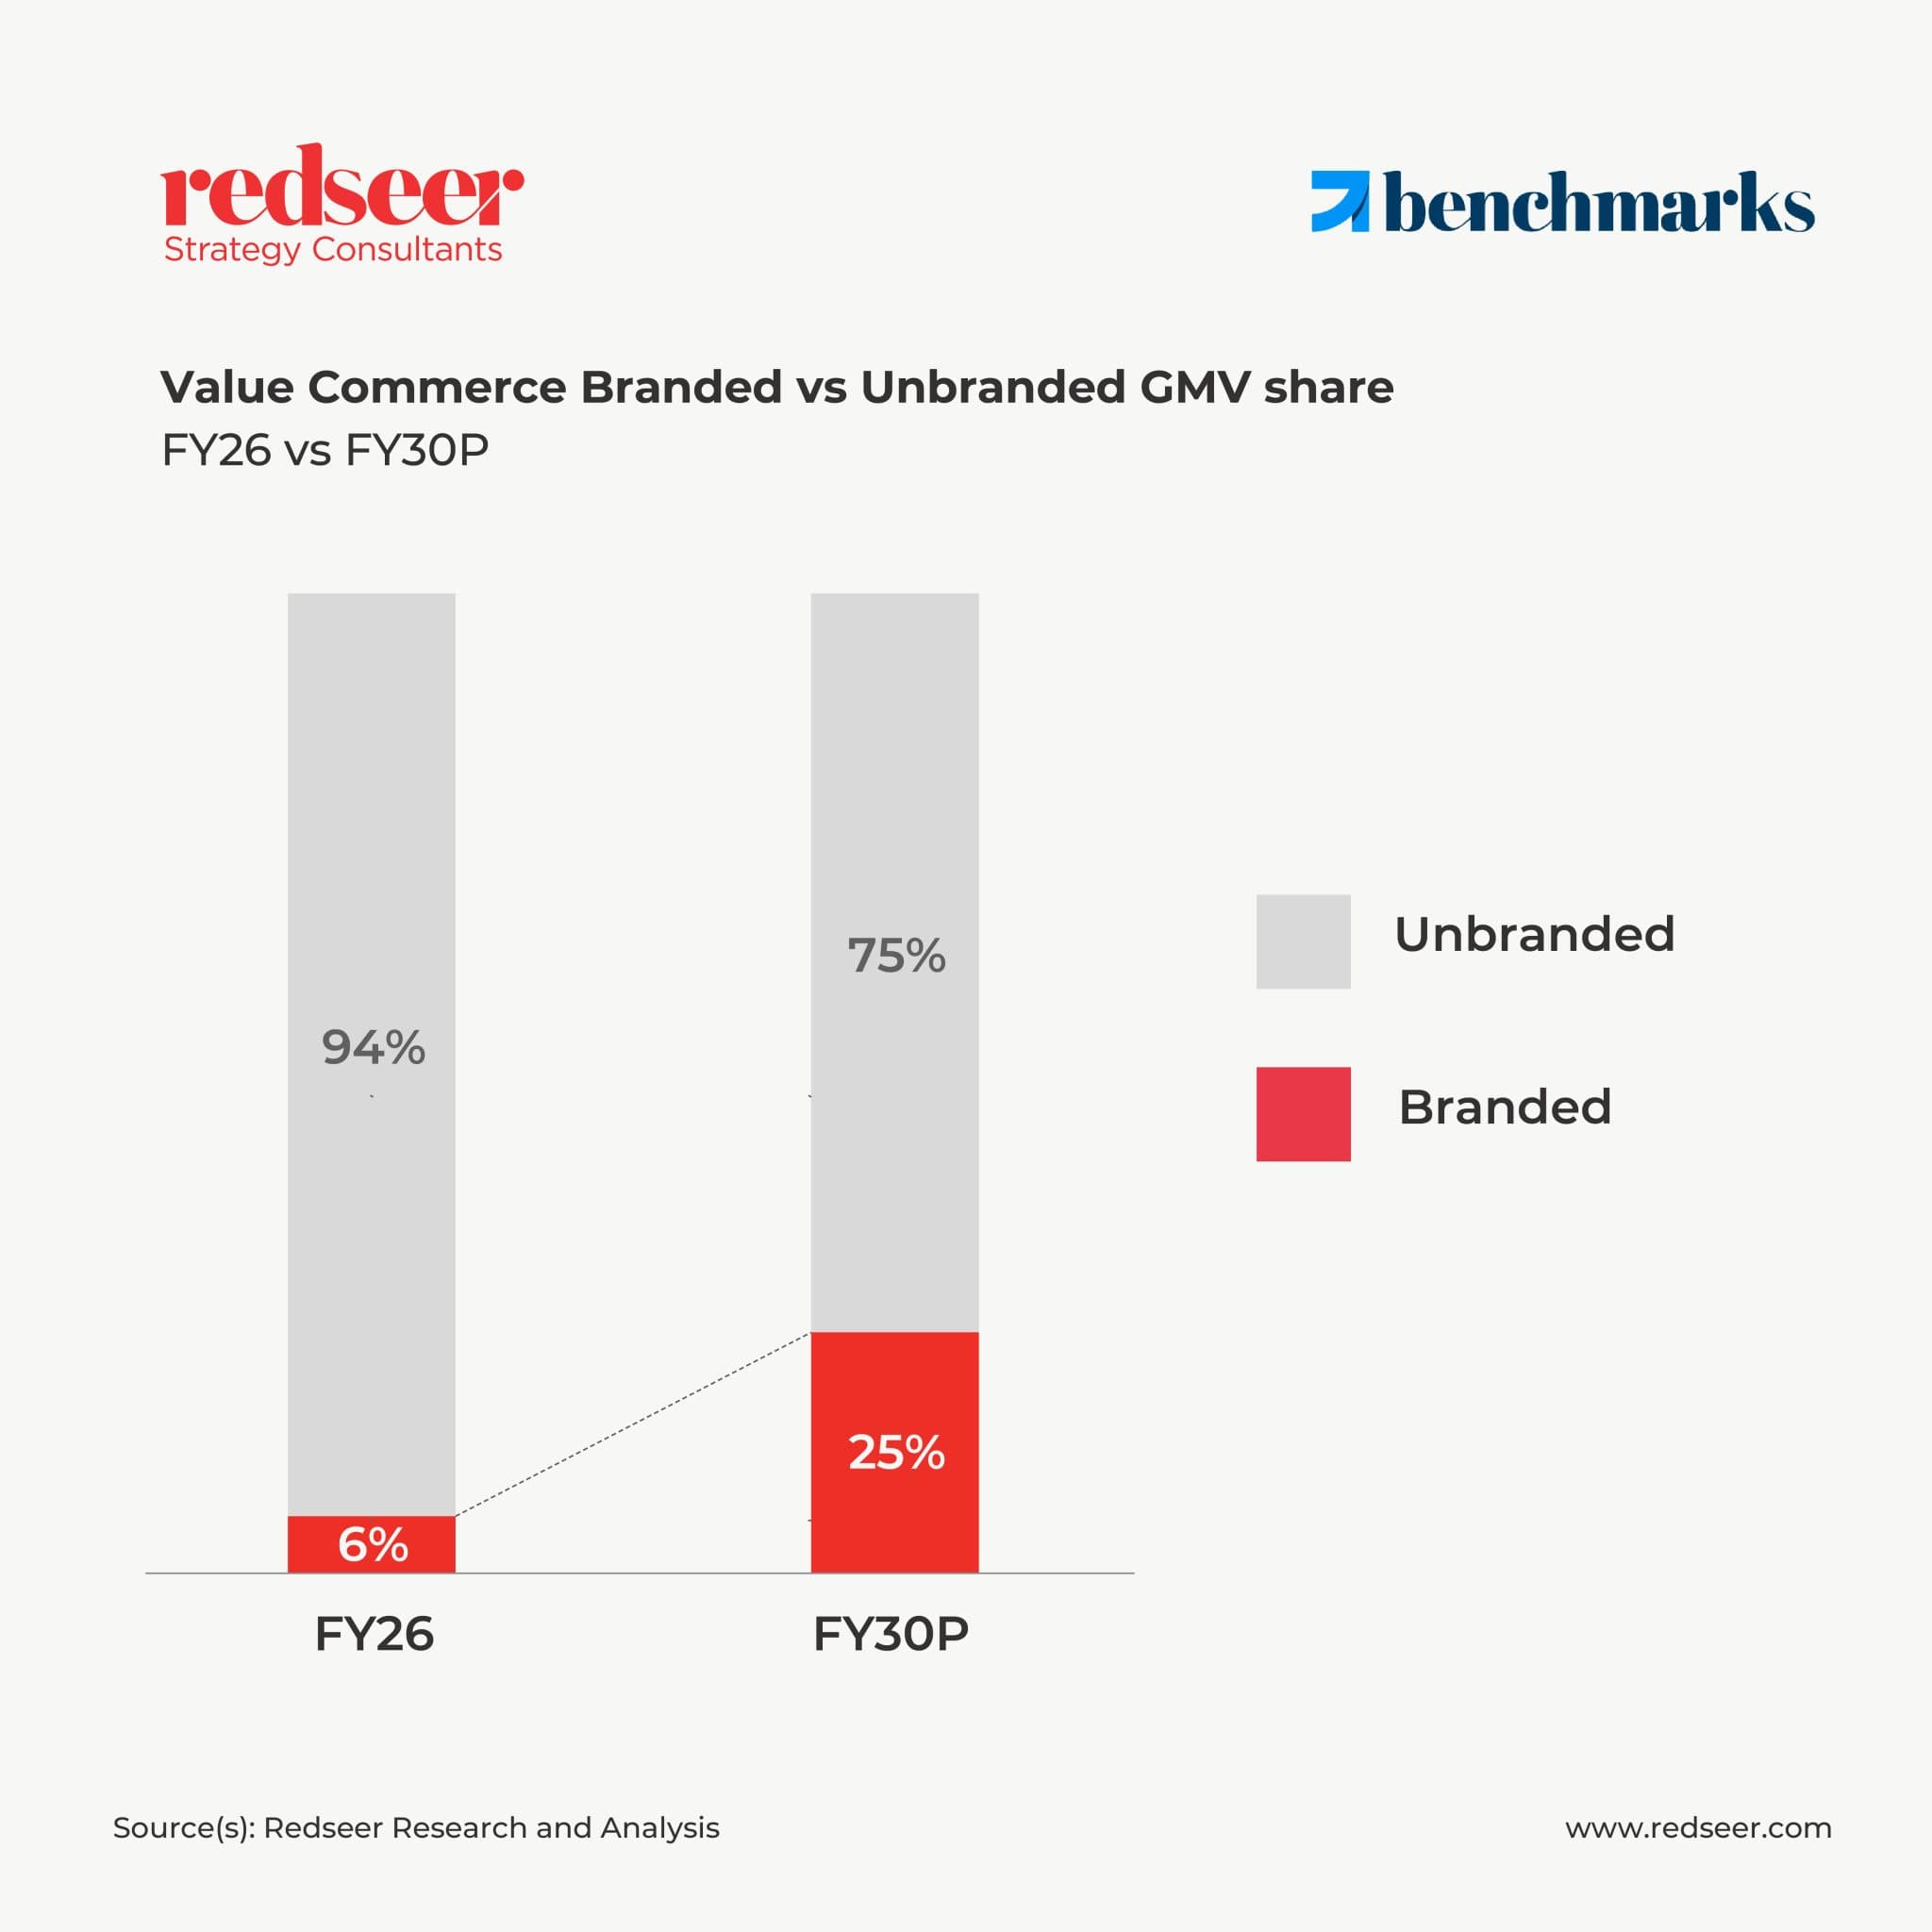
Value Commerce enters FY27 with 250+ million annual transacting users and overall branded penetration of just 6 to 7% across the platform. The Tier 2+ consumer is already demonstrating willingness to spend 10% to 15% above platform average for branded products. Overall branded share within Value Commerce is projected to reach 25% of GMV by FY30, a 4x expansion from FY26 levels.
The early signal of growth is visible across BPC, FMCG, Mobiles, Electronics and Health and Nutrition. Within Beauty and Personal Care, branded penetration has reached ~50% demonstrating the trajectory other categories will follow as the Tier 2+ consumer matures within the ecosystem and brand preference emerges organically.
Outlook | FY30
Quick Commerce growth will be driven by network densification beyond metros, category diversification beyond grocery and deeper wallet share within existing users. Value Commerce growth will be anchored in continued user expansion as digital maturity rises across Tier 2+ India, and branded penetration moves toward 25% of GMV.
Both engines are being built for the same generation, a digitally native, value-conscious, brand-aware cohort and their discretionary spend is projected to nearly double by FY30. Quick Commerce serves the urban, digitally developed segment of that generation. Value Commerce is onboarding the Tier 2+ segment of the same generation for the first time.
Both engines operate in a market that has a runway to serve both at scale, without either of them running out of consumers to reach anytime soon in the future.
The insights have been derived from Redseer ‘Benchmarks’, the most trusted insights platform on the Indian internet landscape. Its proprietary consumer internet data allows us to make granular and long-term comparisons that reveal underlying trends and shifts in consumer behaviour.
Benchmarks track city-level utilisation, expansion mix, and maturity trends across major quick commerce and consumer internet companies, offering its investors, brands, and platforms a clearer lens on how reported growth aligns with underlying economics.

Written by
Drishti Modi
Practice Manager
Drishti joined Redseer in 2021 as a fresh graduate from Ashoka University and has since built deep expertise in India's online retail landscape. As a Practice Manager, her work is centred around Marketplaces and Quick Commerce.

Value Grocery Commerce: The Bharat Unlock

Reinventing Packaged F&B with Quick Commerce

Redseer Enabled a Global Investment Firm to Assess India’s Quick Commerce Market

Smart clicks to win India’s online groceries & general merchandise basket

Redseer advised Meesho on its IPO journey: know what we did and how we did it.

BigBasket’s business growth enabled by Redseer Consulting

The Bharat Unlock: India’s Next Grocery Growth Engine Lies Beyond Quick Commerce

The QC Playbook: How India’s Fastest Growing Channel is Rewriting Packaged F&B Strategy

Quick Commerce Finds Its New Normal with Scale, Mix, and Momentum

Habit or Desire – What’s driving India’s Beauty & Personal Care Market?

India’s Intra-City Parcel Market Growing at 40–50% CAGR: Two Archetypes Racing for the 2 Bn Order Opportunity

Beauty & Personal Care in Quick Commerce: From Convenience to Everyday Relevance
Value Grocery Commerce: The Bharat Unlock
Reinventing Packaged F&B with Quick Commerce
Redseer Enabled a Global Investment Firm to Assess India’s Quick Commerce Market
Smart clicks to win India’s online groceries & general merchandise basket
Redseer advised Meesho on its IPO journey: know what we did and how we did it.
BigBasket’s business growth enabled by Redseer Consulting
The Bharat Unlock: India’s Next Grocery Growth Engine Lies Beyond Quick Commerce
Related Redsights

Value Grocery Commerce: The Bharat Unlock

Reinventing Packaged F&B with Quick Commerce

Redseer Enabled a Global Investment Firm to Assess India’s Quick Commerce Market

Smart clicks to win India’s online groceries & general merchandise basket

Redseer advised Meesho on its IPO journey: know what we did and how we did it.

BigBasket’s business growth enabled by Redseer Consulting

The Bharat Unlock: India’s Next Grocery Growth Engine Lies Beyond Quick Commerce

The QC Playbook: How India’s Fastest Growing Channel is Rewriting Packaged F&B Strategy

Quick Commerce Finds Its New Normal with Scale, Mix, and Momentum

Habit or Desire – What’s driving India’s Beauty & Personal Care Market?

India’s Intra-City Parcel Market Growing at 40–50% CAGR: Two Archetypes Racing for the 2 Bn Order Opportunity
